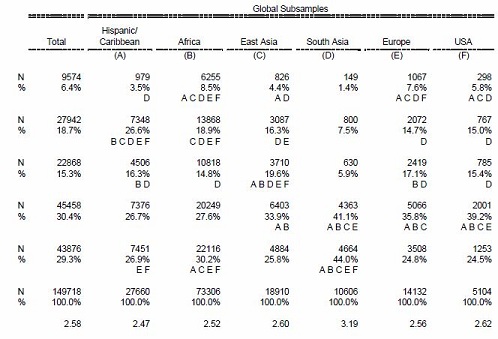
Banner Tables
Banner tables, which are also called crosstabs tables, are used to show interactions of many variables by a few key variables, known as banners. These types of tables are typically used for business reports; however, they may also be used for academic and nonprofit research.

Banner tables are the most common type of quantitative output in the market research industry because they detail the numeric distributions and relationships found in survey data. These tables look very similar to spreadsheets in which the columns represent key groups in the study (e.g., users, non-users, men, women, etc.), and the rows often summarize every response to every significant variable in the survey. In addition, summary measures like the means of variables or measures with percents and Top Two-Box Scores are usually reported along with statistical tests to show where the columns (i.e., key groups) have statistically significant differences.
The experienced statistical consultants at Elite Research have extensive knowledge in analyzing and creating accurate and effective banner tables. We would be happy to assist you in painlessly and efficiently creating the banner tables for your projects.


Feel free to contact Elite to inquire further about how we can help with your tables or help with data analysis.

